
We create digital solutions that work for businesses
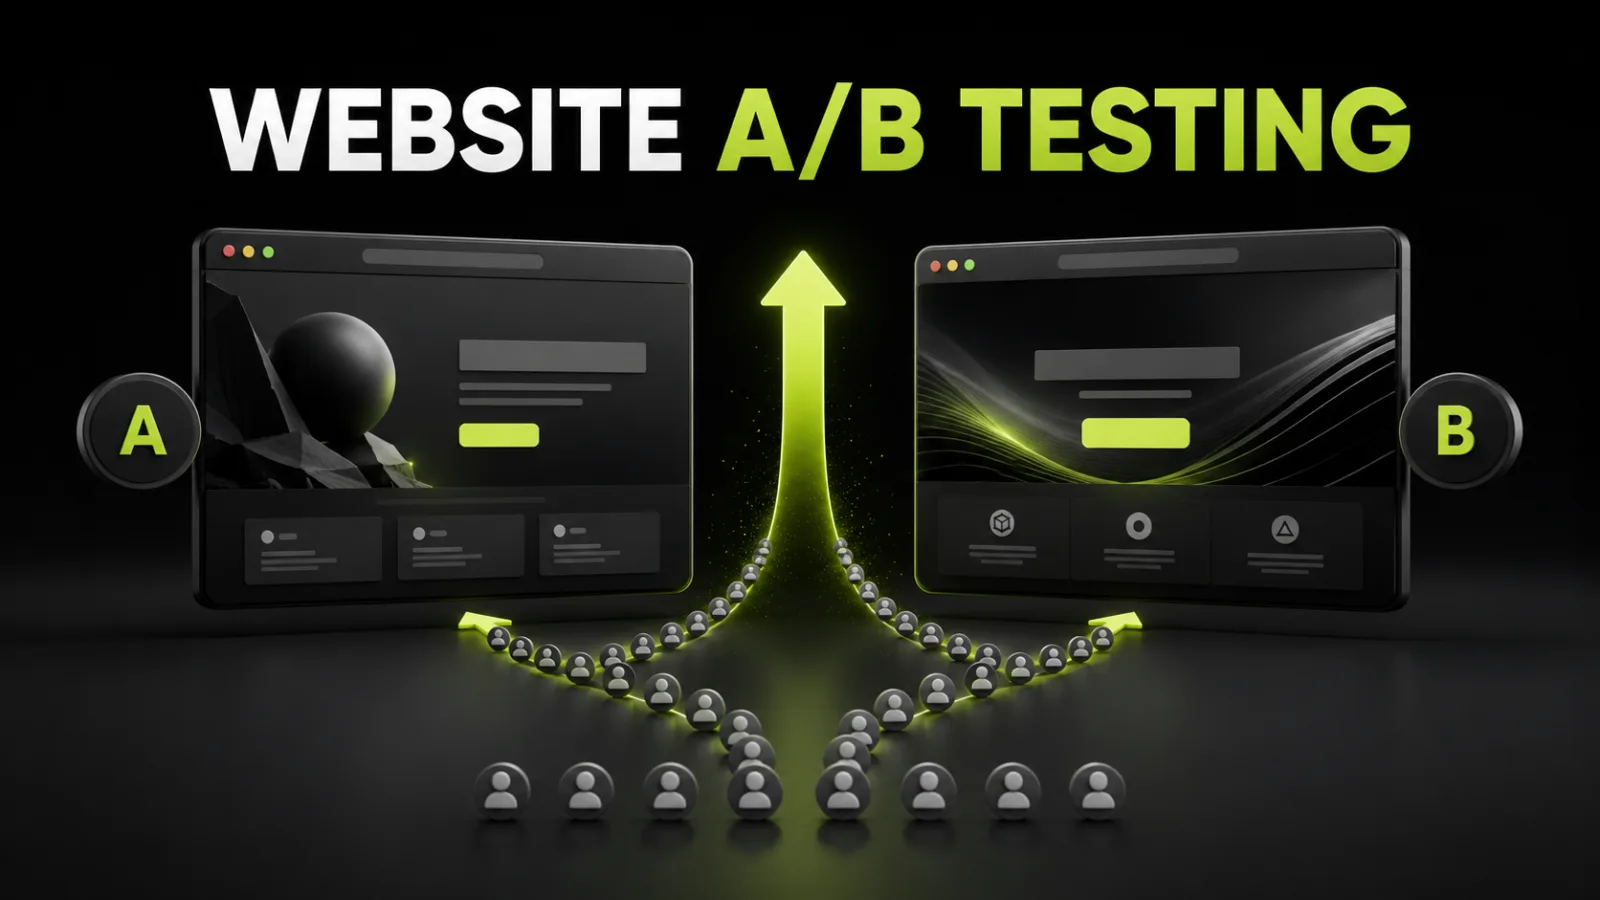
Should you rewrite the headline, shorten the form, show the price, or move the call to action? Any of these changes can improve conversion, have no effect, or reduce sales. The opinion of a designer, owner, or manager cannot answer the question reliably. User behavior can.
A/B testing shows two versions of a page to comparable groups at the same time and evaluates them against a metric chosen in advance. Random traffic allocation alone, however, does not create a valid experiment. You also need a hypothesis, enough observations, reliable tracking, quality assurance, and decision rules defined before launch.
An A/B test is a randomized experiment with two or more variants of the same page or feature. Variant A is usually the current control. Variant B contains the proposed change. Users are randomly assigned to a variant, and the groups run during the same period.
For example, one group may see a seven-field lead form while another sees three fields. The primary metric could be successful form submissions. Lead qualification should be a guardrail metric. If the short form collects more contacts but generates far more irrelevant leads, it is not a useful winner.
Google defines an A/B test as a randomized experiment with two or more variants of the same web page. Random allocation, simultaneous exposure, and a shared objective separate a test from a simple redesign.
Traffic quality, seasonality, campaigns, prices, weekdays, competitors, and the sales team may all change between two time periods. A higher conversion rate after a redesign does not prove that the redesign caused the lift.
In a parallel experiment, external conditions affect both variants at roughly the same time. Randomization also reduces the risk that the new page receives only high-intent users while the control receives colder traffic.
Run a test when:
the page receives stable traffic and has a measurable action;
analytics reveal a meaningful funnel problem;
there are several plausible solutions;
the proposed change can affect leads, sales, revenue, or another valuable outcome;
the result can be rolled out to a meaningful audience;
the business can keep the control unchanged until the test finishes.
Do not test an obvious defect. If the button is broken, the form throws an error, or the mobile checkout cannot be completed, fix it.
Small businesses often have more ideas than conversions. When a site produces only a few leads per month, a test of a minor visual change may take too long to produce useful evidence.
Use session recordings, click and scroll maps, customer interviews, CRM loss reasons, support questions, funnel analysis, usability testing, and technical QA first. Test a larger concept only when it has a plausible chance of producing a noticeable effect. In many cases, qualitative research is more useful than an underpowered experiment.
A useful format is:
If we [make this change], then [primary metric] will change because [evidence-based reason]. We will consider the test successful when [decision criterion].
Example: “If we show a starting price and three deliverables in the hero section, more paid-search visitors will proceed to the lead form because session recordings show that people search for pricing and leave before reaching the price block. Success means more completed forms without a decline in qualified-lead rate.”
“Make the button green because it will stand out” is weak unless the data show that people fail to notice the call to action.
GA4 funnel drop-offs;
paid and organic search queries;
session recordings and rage clicks;
click and scroll maps;
form and internal-search errors;
questions asked during sales calls;
lost-deal reasons in the CRM;
customer support conversations;
moderated usability tests;
competitor patterns used as inspiration, not proof.
Score each hypothesis from 1 to 10 for:
Impact: the expected effect on a valuable outcome;
Confidence: the strength of supporting evidence;
Ease: implementation and measurement effort.
Start with hypotheses that combine meaningful impact, credible evidence, and manageable effort. Add a risk score for changes that can affect legal compliance, SEO, speed, payments, integrations, or lead quality.
Choose one decision metric: purchase rate, completed lead form, booking, revenue per user, or progression to a critical funnel step.
Use these to explain the mechanism: CTA clicks, form starts, add-to-cart rate, checkout starts, or average order value.
Protect the business from a misleading win: cancellations, returns, errors, page speed, margin, qualified-lead rate, or support contacts.
Do not switch the primary metric after seeing the results. Searching many metrics for a positive number increases the risk of a false conclusion.
There is no universal “seven-day” rule. Required sample size depends on:
control conversion rate;
minimum detectable effect, or MDE;
number of variants;
statistical significance threshold;
desired statistical power;
percentage of traffic included in the test.
Enter these values into a sample-size calculator before development. Detecting a small change requires much more traffic than detecting a large one. Distinguishing 2% from 2.1% is harder than distinguishing 2% from 3%.
The experiment should cover complete business cycles, including weekdays and weekends when relevant, but calendar duration does not replace the required sample. Do not stop when B first moves ahead.
A higher observed conversion rate does not automatically make B better. Random variation in the users assigned to each group can create a temporary difference.
Statistical significance helps evaluate whether the observed data are compatible with a real difference under the chosen model rather than ordinary noise. A 95% threshold is common, but it does not mean a 95% guarantee of future success. Sample size, effect size, measurement quality, and commercial value still matter.
A tiny lift can be statistically persuasive on very large traffic and still be too small to justify development. A large percentage lift based on a handful of conversions can be unreliable.
Find the bottleneck. Identify the page, audience, and funnel step where the loss is greatest or most expensive.
Collect evidence. Combine GA4 data with session recordings, surveys, CRM information, and sales feedback.
Write the hypothesis. Define the change, expected result, reason, and success criterion.
Lock the metrics. Select one primary metric plus secondary and guardrail metrics.
Estimate the sample. Use baseline conversion, MDE, significance, power, and number of variants.
Build variant B. Change only what the hypothesis requires. A full redesign can compare two concepts but cannot reveal which individual element caused the effect.
Complete QA. Test devices, browsers, forms, payments, tracking, speed, visual flicker, and consistent variant assignment.
Launch without casual intervention. Avoid changing the page, campaigns, or counting rules. Document unavoidable external events.
Analyze and record the decision. Review primary and guardrail metrics, sample size, data quality, and anomalies. Ship, iterate, or reject the idea.
Google Optimize is no longer available. A website experiment now requires a third-party platform or an in-house implementation. GA4 can receive experiment and variant identifiers and help analyze group behavior, while the experiment platform allocates users and applies variants.
A practical data flow is:
the platform randomly assigns a variant;
the user consistently sees the same experience;
experiment_id and variant_id are sent with analytics data;
business actions are recorded as GA4 events;
results are analyzed by variant;
the CRM validates lead quality and completed sales.
GA4 does not replace the experiment platform’s statistical engine. Google states that running an A/B test with Analytics requires integration with a third-party testing tool.
| Element | Hypothesis example | Primary metric |
| Hero headline | Lead with the outcome instead of a generic slogan | Form progression |
| Offer | Show a clear package instead of “custom quote” | Qualified leads |
| Pricing | Add a starting price or range | Lead rate and quality |
| CTA copy | Use a specific action instead of “Learn more” | Completed action |
| Form | Reduce first-step fields | Successful submissions |
| Social proof | Place a relevant case study near the CTA | Contact progression |
| Mobile action | Add a persistent call or booking button | Calls or bookings |
| Product page | Show delivery and returns near Add to Cart | Add-to-cart rate |
| Checkout | Allow guest checkout | Purchase rate |
| Landing-page order | Address objections earlier | Revenue per user |
Another company’s winning test is only an idea, not evidence that the same change will work for your audience.
testing without a documented problem;
changing many unrelated elements at once;
using an insufficient sample;
stopping as soon as the graph looks positive;
choosing a winner by clicks when the business needs sales;
ignoring mobile traffic;
uneven traffic-source allocation;
allowing one user to alternate between A and B;
duplicated or missing analytics events;
slowing the page with testing scripts;
reviewing dozens of metrics for a convenient winner;
failing to validate tracking after the winning variant is deployed.
Ask five questions:
Did the experiment reach the planned sample?
Did it meet the predefined statistical criterion?
Is the effect large enough to justify implementation?
Did any guardrail metric deteriorate?
Is there evidence of a tracking bug or group imbalance?
Review important device, new-versus-returning, and traffic-source segments afterward. Treat an unplanned segment finding as exploratory unless it has adequate data and was part of the original decision framework.
If B wins, check guardrails, deploy the change, validate production analytics, and monitor the outcome. If the control wins, keep A and document what the team learned. The test protected the business from a harmful rollout.
An inconclusive result is not automatically a failed test. The real effect may be smaller than the MDE, the change may be too subtle, or traffic may be insufficient. Follow the method’s stopping rules, design a stronger variant, or move to a higher-priority hypothesis.
A/B testing is not a design contest or a way to confirm a preferred idea. It is a disciplined process: find a problem, build an explanation, choose a metric, collect enough evidence, and decide according to rules defined before launch.
A mature experimentation program does not promise that every variant will win. It reduces the risk of website changes, accumulates knowledge about customers, and directs development toward improvements that affect leads, sales, and revenue.
BB STUDIO can audit the analytics setup, prioritize hypotheses, build the variant, and implement an experiment appropriate for the website’s actual traffic.
 Design & UI/UX
 Analytics and Conversion
 Analytics and Conversion
 Google Ads
 Let’s create something amazing together
